Analytics uses raw data and math to discover, interpret, and communicate significant data patterns. When used correctly, data analytics can help answer business questions, predict outcomes, and create actionable insights.
Why is data analytics a must-have feature for all businesses?
An analytics overview is an invaluable part of your software for customer service management. It can help you pinpoint the exact areas of your business that need improvement. Finding “laggards” and areas that could be optimized is always great because it presents an opportunity to:
- Improve your agent’s performance
- Provide additional training to those that need it
- Improve customer satisfaction, experience, and sales
- Reallocate resources
- Reinforce support channels
- Find more cost-effective ways to solve problems
In addition to that, an analytics overview can also showcase areas of your business that are thriving. This is important because:
- You won’t have to overhaul your whole business/support strategy
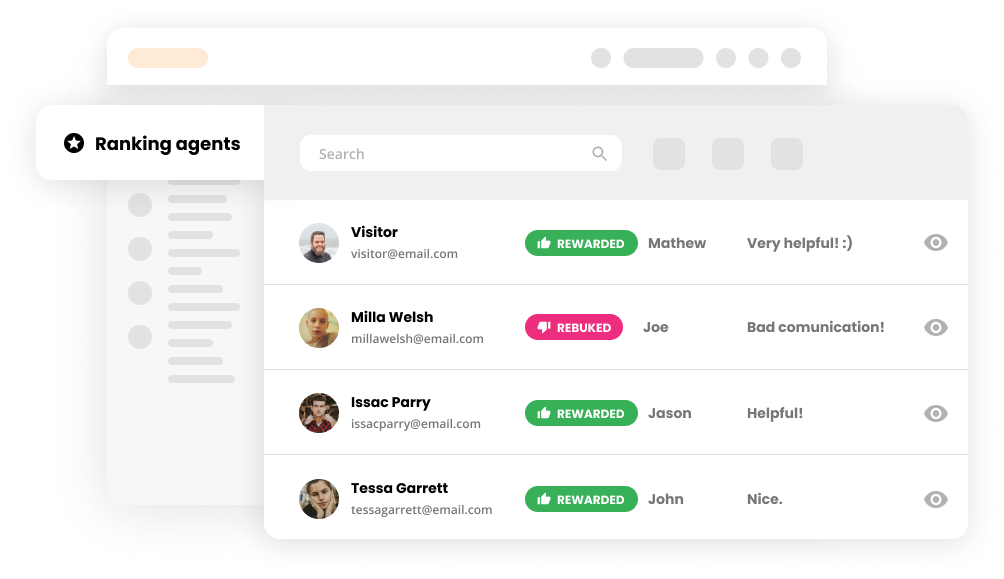
- You’ll be able to reward overachievers
- Underperformers will be able to learn from overachievers
What does the LiveAgent analytics overview feature do?
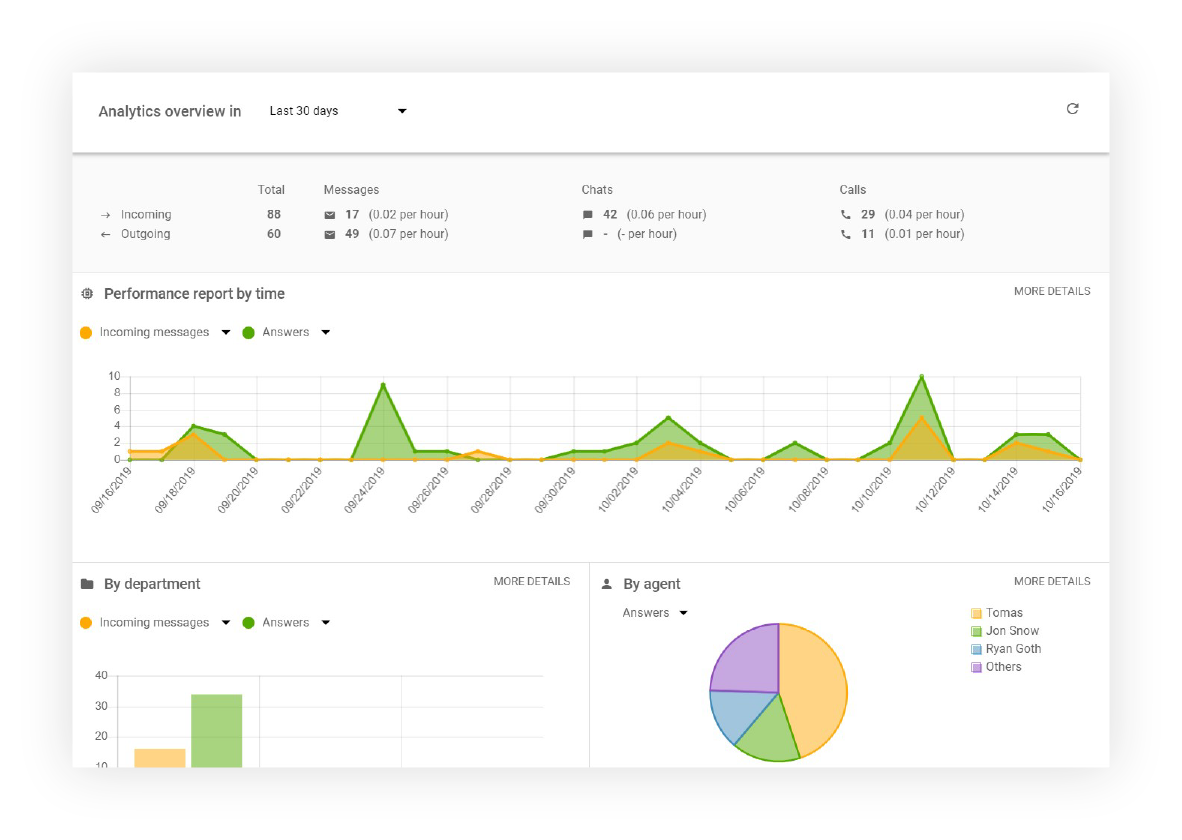
Accessible and convenient data is an invaluable part of the best help desk software solutions in today’s market. The analytics overview gives you a holistic overview of your customer support. You’ll be able to see who is interacting with your company and monitor the service they’re receiving. You’ll also be able to review usage statistics by channel, evaluate performance reports, and learn from customer satisfaction ratings. In addition to that, our analytics overview is packed with endless reporting capabilities.
What can you see in the analytics overview dashboard?
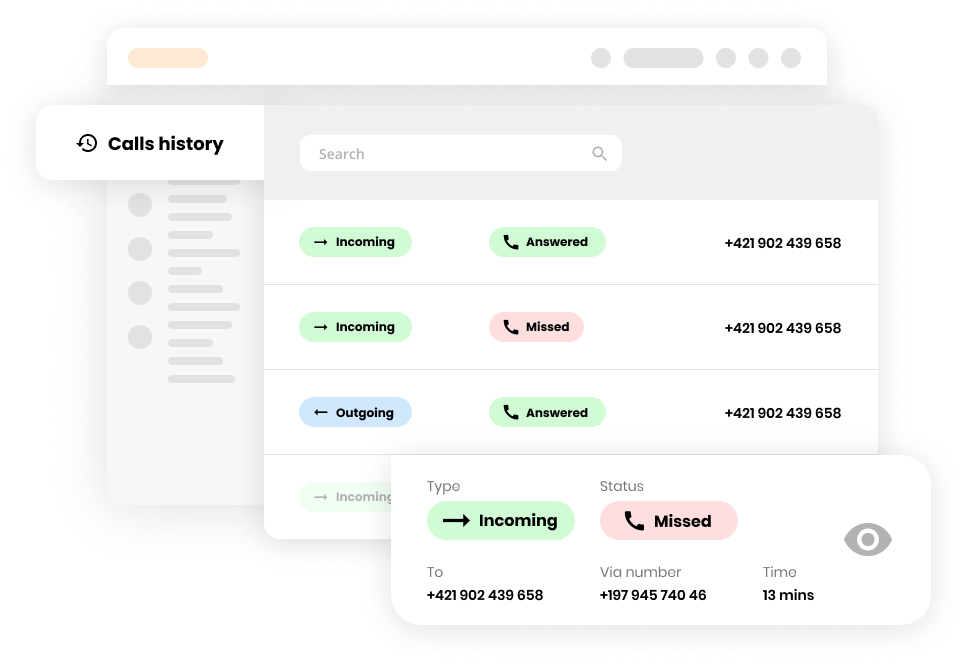
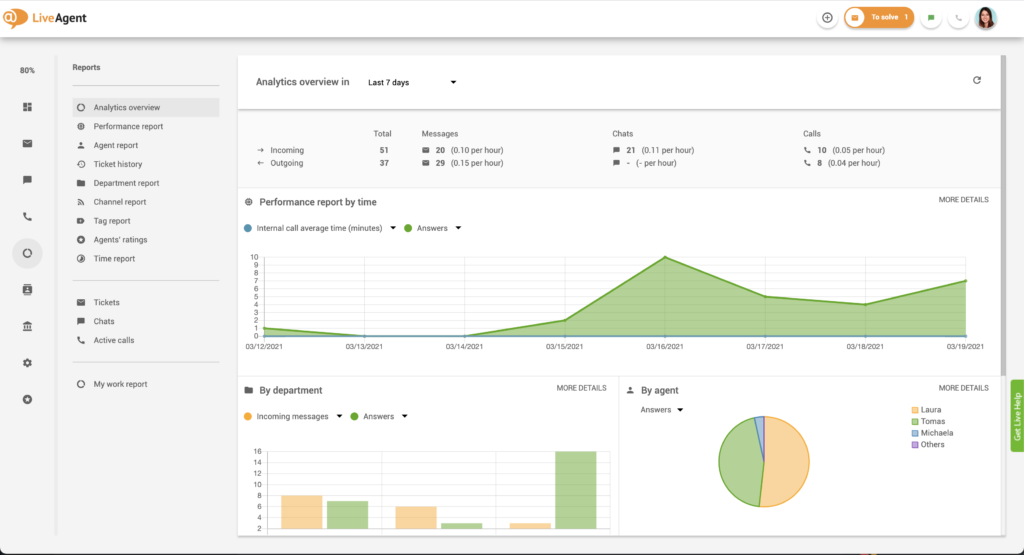
The analytics dashboard gives you a quick overview of all incoming and outgoing messages, chats, and calls.

Incoming messages are defined as:
- All emails that are fetched into LiveAgent
- All offline tickets created via contact forms or offline chat buttons
- Tickets created from Twitter, Instagram, Viber, and Facebook (Twitter mentions by other people only)
- All other communication received in existing tickets
Outgoing messages are defined as:
- Tickets replies
- All emails, Tweets, Instagram and Viber messages, as well as Facebook posts posted via the application
- New emails sent from the application
Stand out from your competitors with a strong customer service culture
Handle all customer inquiries from one interface. Start improving your customer service with a free 30-day trial today!
Chats are defined as:
- Chats initiated by customers and agents
- Chats answered by agents
Calls are defined as:
- Calls initiated by a customer (either via call widgets or phone numbers)
- All calls that initiated from the application even when the customer doesn’t answer
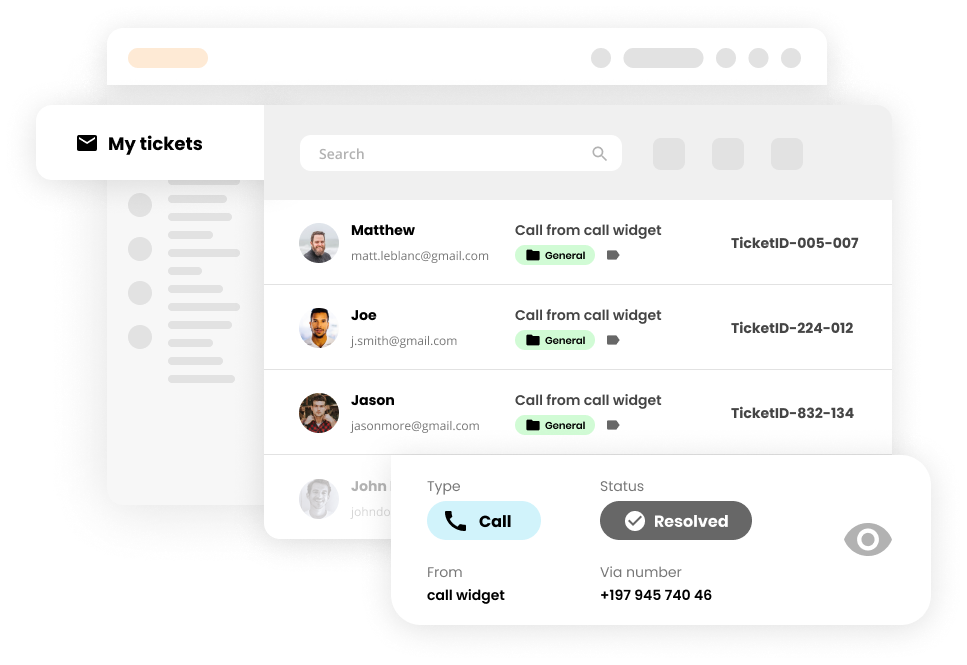
Filtering results
You can filter your analytics overview by:
- Time
- Department
- Agent
- Tag
- Channel
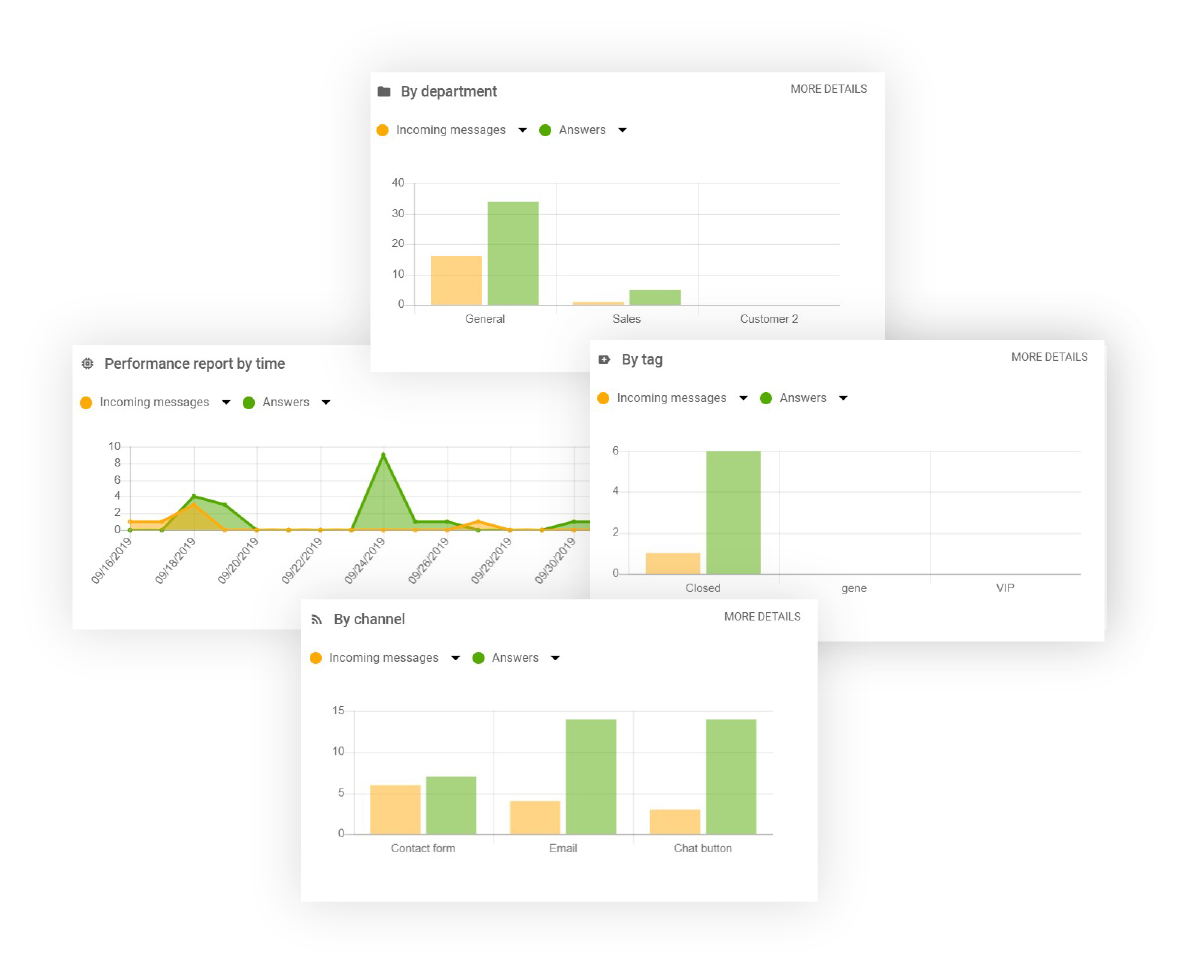
Each performance report can be modified to showcase additional data including:
Ticketing metrics
- Answers
- Notes
- New answer average time (in hours)
- New answer average time SLA (in hours)
- First assign average time (in hours)
- First assign average time SLA (in hours)
- First resolve average time (in hours)
- First resolve average time SLA (in hours)
- Open answer average time (in hours)
- Open answer average time SLA (in hours)
Live chat metrics
- Created tickets
- Resolved tickets
- Chat messages
- Chats
- Missed chats
- Chat pick up
- Chat pick up average time (minutes)
- Chat average time (minutes)
- Not rated
- Not rated in %
Call center metrics
- Positive ratings
- Positive ratings in %
- Negative ratings
- Negative ratings in %
- Calls
- Outgoing calls
- Missed calls
- Call minutes
- Outgoing call minutes
- Call pick up average time (minutes)
Customer satisfaction metrics
- Call average time (minutes)
- Outgoing call average time (minutes)
- Internal calls
- Internal call minutes
- Internal call average time (minutes)
- Incoming messages
- Incoming chats
- Finished chats
- Unanswered chats
- Incoming calls
- Finished calls
- Unanswered calls
- Voicemails
Each report can be filtered by different time periods including:
- Today
- Yesterday
- Last 7 days
- Last 30 days
- Last 90 days
- This week (Mon-Sun)
- Last week (Mon-Sun)
- Last working week (Mon-Fri)
- This month
- Last month
- This year
- Last year
- Custom date
Choosing how data is presented
LiveAgent can present all the above-mentioned data in multiple formats, including area charts, line graphs, bar graphs, and pie charts. Moreover, all data can be exported into CSV files, making it easier to share with others.
How to find your analytics dashboard in LiveAgent
The analytics dashboard is visible to administrators only, so make sure you’re an admin of your LiveAgent account (agents can see their personal statistics upon logging into LiveAgent.)
If you do have the administrator role, you can find the analytics overview by clicking on Reports (circle icon) that’s in the left-hand menu (right between Calls and Customers).
Knowledge base resources
To learn more about the different types of reports available in our analytics dashboard please check out our knowledge base articles:
Monitor your agent’s performance
Find out who’s excelling and who needs extra training based on agent performance reports. Check them out today for free. No credit card required.
Ready to discover more about your business?
Take a deep dive into your support efforts. Start improving your performance, sales, and customer satisfaction today with our free 30-day trial. No credit card required.
Ready to unlock the power of data to improve your customer support?
Make data-driven decisions, identify trends, and optimize your support operations. Harness the potential of analytics with LiveAgent's Analytics Overview feature today!
Frequently Asked Questions
How is data presented?
Data can be presented in multiple formats, including area charts, line graphs, bar graphs, scatter graphs and pie charts.
What is analytics?
Analytics is the study of data and math to discover, interpret, and communicate significant data patterns.
Why is data analytics a must-have feature for all businesses?
An analytics overview can help you pinpoint the exact areas of your business that need improvement.
Provide excellent customer service
Discover unparalleled customer support with LiveAgent's all-in-one software. Benefit from 24/7 service, a free trial without a credit card, and seamless integration across 130+ ticketing features. Enhance your business with fast setup, AI assistance, live chat, and more. Choose LiveAgent for exceptional service and satisfied customers.

 Български
  Čeština
  Dansk
Dansk  Deutsch
  Eesti
Eesti  Español
  Français
  Ελληνικα
  Hrvatski
  Italiano
  Latviešu
  Lietuviškai
  Magyar
  Nederlands
  Norsk bokmål
  Polski
  Română
  Русский
  Slovenčina
  Slovenščina
  Svenska
  简体中文
简体中文  Tagalog
  Tiếng Việt
  العربية


